Wednesday, July 21, 2010
Macau Gaming Industry
Chanced upon a paper today on Macau's Gaming Industry. It's a little dated (1Q 2009), but it has quite a lot of information. Essential read for the investor who intends to invest in the gaming industry in Macau.
Saturday, July 3, 2010
Portfolio Summary June 2009
A down month for most portfolios, with growth concerns over China, Japan's slowing recovery, and a slower than expected recovery in the United States contributing to dropping indexes. Another point of note was Spain's credit rating which was put under review.
Well on a lighter note, world cup has been keeping me (and everyone else) up. So I wish to apologize for the lack of updates, as juggling world cup, work and sleep isn't a very fun thing to do.
 Among my holdings the only news that was announced was for these following companies.
Novo Group - Results
Novo Group's results were released on the 21st of June. The results were disappointing with 4Q revenue decreasing over last year. Recall that the 4Q last year was from the period from Mar to Jun 09 where the global economy was just recovering, and economies in North East Asia being in their recovery phase.
Novo attributed the decrease to a slower growth rate in China and a rein in property development in china, decreasing the demand in steel. Steel has seen excess supply especially for those needed in construction of infrastructure. However, cold rolled steel for the manufacturing of appliances is still in demand. However, with credit reigned in in China, and excess supply in India seems to depress demand and pricing for steel.
I am looking to unload Novo in the near future, with steel pricing forecasted to not pick up before 2012.
The dividend payable for the year is at 0.5 cents per share.
YRC Worldwide - Asset Sale
YRC Worldwide has sold off its logisitics arm to Austin Ventures for $37 million. A quick calculation of the debt remaining after exhausting their loan capacity and repayment of trade payables and loans totalled about 93 million for 2010.
YRC Worldwide needs to generate a positive EBITDA, as well as positive cash flow to ensure liquidity does not dry up. The operational statistics seem to be bottoming out, and the next release of results will be crucial in determining it. The most important thing in the trucking industry is that while there is still excess capacity, the price wars are over and most trucking firms are aiming to reduce capacity.
China Star Entertainment - Bonus Issue
China Star Entertainment issued 1 bonus warrant for every 4 shares held. I made a mistake previously, as I commented that the warrants will be sold off. In fact, my broker has informed me that my warrants are held in my account already, and I had to incur a charge of SGD9.21. I am travelling to Macau and Hong Kong in August, and hopefully I'll have the chance to either meet the management, and visit their hotel in Macau.
Sunday, June 6, 2010
Portfolio Summary May 2010
Depends on how you look at it, this month proved either hard to stomach for investors, or provided a good buying opportunity. For me, I saw this month as a buying opportunity as I deployed my remaining cash. I still have the ability to use other cash that I have saved up but have not factored into the cost.
Over the month of May, the S&P500 shed about 100 points off its value (8.4%). The same stories arose this month, with debt being the main focus. This week however, renewed doubt over the recovery, with private hiring not up in the US.
Doubts over China's growth also took place in May, with a slowdown in the manufacturing sector reported.
 My porfolio took a hit last month, and as of the end of May, I am 2.9% in the red.
First Resources
No news was reported for First Resources this month. Dividends was received on the 18th of May 2010 for Year End 2009
China Telecom
At the AGM, all motions were duly passed. This includes a HKD0.085 dividend per share to be issued on the 30th of June 2010
Novo Group
Novo disposed of its downstream subsidiary to its partner. The disposal is not expected to have any material impact on its results.
The reason given is as follows,
"In view that the definitive terms and conditions imposed bythe relevant authorities are more stringent than the original understandings of the Company, inparticular, in respect of the investment commitment requirements, the Company has decidednot to participate in the Project at this stage... JV Partner has already signed a legal binding MOU with the Group, offering a first right of refusal to subscribe for up to 60% of the equity in the investment holding company controlled by the JV Partner that will be undertaking the Project."
In my opinion, this is a step back for the company. Firstly, it has underestimated the problems that it may encounter when setting up a subsidiary in China. Next, in my opinion, it is a blow to the company that it has failed to expand its downstream operations.
However, as the project has not started, and as such is not expected to have any material impact, I would still be interested to see where Novo Group heads.
Soilbuild
Soilbuild announced its 1Q2010 results this month. Although sales were down, due to a decrease in revenue from property development, rental income increased by 40% year on year. This is positive for the company as it strives to achieve its 40million revenue from rental income.
NAV increased by 5 cents to 1.29, in spite of an increase in number of shares (1,516,000) due to exercise of warrants.
China Star Entertainment
A bonus issue of warrants is slated to be done, pending shareholder approval. The subscription price is HKD0.193. For foreign shareholders, the warrants will be sold at the first possible opportunity, and the proceeds will be credited to the shareholder account
Courage Marine
I purchased Courage Marine at SGD0.185 on the 22nd of May. I previously looked at the Shipping sector, and as the turnaround in container shipping is expected, the dry bulk shipping sector would typically be correlated to the turnaround in container shipping, albeit a little slower.
Courage Marine has a very strong balance sheet, and by purchasing 2nd hand ships, they would obtain a higher return on investment. The fact that Courage charters out ships typically using spot prices, means it would gain the full benefit on the turnaround of container shipping.
Its revenue has increased not only year on year, but also quarter on quarter, and gross margins have been improving. This points to a possible turnaround in shipping.
I did not over BGEM and YRCW, as I am still in the process of redoing my portfolio.
Saturday, May 15, 2010
YRC Worldwide 1Q Results
YRC Worldwide Reports First Quarter 2010 Results
--YRC National Reports Year-over-Year Adjusted EBITDA Improvement --YRC Regional Reports Third Straight Quarter of Positive Adjusted EBITDA
OVERLAND PARK, Kan., May 4, 2010 /PRNewswire via COMTEX/ -- YRC Worldwide Inc. (YRCW 0.44, +0.00, +0.16%) today reported its first quarter 2010 results. For the quarter ending March 31, 2010, the company announced a loss per share of $.33 when excluding a previously announced charge of $.20 per share for union employee equity-based awards, and a $.53 loss per share when including that item. By comparison, the company reported a $4.61 loss per share in the first quarter of 2009.
"Despite the headwinds from the note exchange in the latter part of December and the harsh winter weather we experienced during January and February, we are pleased with the sequential operating improvement during the quarter and the traction we achieved in the month of March," stated Bill Zollars, Chairman, President and CEO of YRC Worldwide. "The Regional companies have a lot of momentum, while YRC has stabilized its customer base and streamlined its sales force, and is poised for growth going forward."
For the first quarter of 2010, the company reported operating cash flow of $18 million, including the receipt of the previously announced $82 million income tax refund in late February. The company issued $50 million of 6% notes on February 23, 2010, and used the net proceeds from these new notes to redeem its remaining 8.5% notes that were due April 15, 2010. In addition, the company repaid $29 million on its asset-backed securitization ("ABS") facility primarily from collections of its fourth quarter revenues. At March 31, 2010, the company reported cash and cash equivalents of $130 million, unused revolver reserves of $107 million and unrestricted availability of $4 million under the company's $950 million revolving credit facility.
"Our operating results improved sequentially throughout the quarter as reflected in our adjusted EBITDA of $(27) million in January, $(21) million in February, and $(5) million in March," added Sheila Taylor, Executive Vice President and CFO of YRC Worldwide. "We continue to remove additional cost from the business and more effectively manage our working capital, which has allowed us to preserve liquidity under our credit facility."
Adjusted EBITDA is a non-GAAP measure that reflects the company's earnings before interest, taxes, depreciation, and amortization expense, and further adjusted for letter of credit fees and other items as defined in the company's Credit Agreement. "Adjusted EBITDA" and "loss per share when excluding the charge for union employee equity-based awards" are used for internal management purposes as financial measures that reflect the company's core operating performance. In addition, adjusted EBITDA is used by management to measure compliance with financial covenants in the company's Credit Agreement. However, these financial measures should not be construed as a better measurement than operating income or earnings per share, as defined by generally accepted accounting principles. See the reconciliation of GAAP measures to non-GAAP financial measures below.
Key Segment Information
First quarter 2010 compared to the first quarter 2009:
YRC National Transportation total shipments per day down 33.6%, total tons per day down 34.6%, with March tons per day down 22.5%, and total revenue per hundredweight, including fuel surcharge, up .4%.
YRC Regional Transportation total shipments per day down 12.9%, total tons per day down 9.1%, with March tons per day down 3.2%, and total revenue per hundredweight, including fuel surcharge, down 2.3%.
Additional statistical information is available on the company's website at yrcw.com under Investors, Earnings Releases & Operating Statistics.
Outlook
During April, YRC National and YRC Regional volumes increased compared to March, as both sequential trends were slightly better than normal seasonal patterns.
"We appreciate the continued confidence our customers have shown by increasing their shipments with us throughout the quarter and into April," stated Mr. Zollars. "With our current operating momentum, we still believe we will generate positive adjusted EBITDA in the second quarter."
In addition to the above, we have the following expectations for 2010:
Gross capital expenditures in the range of $50 to $75 million
Real estate sales in the range of $25 to $50 million
Sale and financing leasebacks of approximately $50 million, primarily in the second half of the year
Interest expense in the range of $40 to $45 million per quarter, with cash interest of $10 million to $12 million per quarter
Effective income tax rate of 2%
Outstanding shares of 1.054 billion, prior to any adjustments for a reverse stock split and the issuance of equity
Amendment to Credit Facilities
On May 3, 2010, the company completed amendments to its $950 million revolving credit facility and $400 million ABS facility. Under the revolving credit facility, the company may retain up to $100 million of net proceeds from the issuance of equity prior to December 31, 2010. Previously, the lenders would have received 50% of the net proceeds from an equity issuance. In addition, the company's financial covenants were reset for the remainder of 2010 to take into account the impact to the company's customer base from the delayed note exchange at the end of 2009. The adjusted EBITDA covenants are $5 million for second quarter of 2010, $50 million cumulative for second and third quarters of 2010, and $100 million cumulative for second, third and fourth quarters of 2010. In addition, the company is required to maintain minimum available cash (as defined in its credit agreement) of $25 million through the remainder of the year.
"These amendments are another indication of the support our lenders continue to provide as we manage past the seasonally slowest time of year and rebuild our value in the market place," stated Ms. Taylor. "We are also encouraged with the activity in the equity markets and expect to be opportunistic throughout the year."
Review of Financial Results
YRC Worldwide Inc. will host a conference call for shareholders and the investment community today, Tuesday, May 4, 2010, beginning at 9:30am ET, 8:30am CT. The conference call will be open to listeners via the YRC Worldwide Internet site yrcw.com. An audio playback will be available after the call also via the YRC Worldwide web site.
             Reconciliation of GAAP Measures to Non-GAAP Financial
                              Measures (unaudited)
             -----------------------------------------------------
   (in millions)                            January       February  March
   -------------                                2010          2010    2010
                                                ----          ----    ----
   Reconciliation of operating loss
    to adjusted EBITDA:
   Operating loss                               $(49)         $(42)  $(146)
         Depreciation and amortization            17            17      18
         Equity based compensation expense         1             1     108
         Letter of credit expense                  3             3       3
         Losses on property disposals, net         -             -       9
         Impairment charges                        -             -       5
         Other, net                                1             -      (2)
                                                 ---           ---     ---
   Adjusted EBITDA                              $(27)         $(21)    $(5)
                                                ====          ====     ===

   For the Three Months Ended March
    31
   --------------------------------
   (in millions)                                2010          2009
   -------------                                ----          ----
   Reconciliation of operating loss
    to adjusted EBITDA:
   Operating loss                              $(237)        $(379)
         Depreciation and amortization            52            66
         Equity based compensation expense       110            33
         Letter of credit expense                  9             5
         Losses on property disposals, net         9             2
         Impairment charges                        5             -
         Other, net                               (1)           (2)
                                                 ---           ---
   Adjusted EBITDA                              $(53)        $(275)
                                                ====         =====

   Adjusted EBITDA by segment:
         YRC National Transportation            $(60)        $(239)
         YRC Regional Transportation               8           (50)
         YRC Logistics                            (6)           (1)
         YRC Truckload                             -             -
         Corporate and other                       5            15
                                                 ---           ---
   Adjusted EBITDA                              $(53)        $(275)
                                                ====         =====
Forward-Looking Statements:
This news release and statements made on the conference call for shareholder and the investment community contain forward-looking statements within the meaning of Section 27A of the Securities Act of 1933, as amended, and Section 21E of the Securities Exchange Act of 1934, as amended. The words "believe," "expect," "continue," and similar expressions are intended to identify forward-looking statements. It is important to note that the company's actual future results could differ materially from those projected in such forward-looking statements because of a number of factors, including (among others) our ability to generate sufficient cash flows and liquidity to fund operations, which raises substantial doubt about our ability to continue as a going concern, inflation, inclement weather, price and availability of fuel, sudden changes in the cost of fuel or the index upon which the company bases its fuel surcharge, competitor pricing activity, expense volatility, including (without limitation) expense volatility due to changes in rail service or pricing for rail service, ability to capture cost reductions, changes in equity and debt markets, a downturn in general or regional economic activity, effects of a terrorist attack, labor relations, including (without limitation) the impact of work rules, work stoppages, strikes or other disruptions, any obligations to multi-employer health, welfare and pension plans, wage requirements and employee satisfaction, and the risk factors that are from time to time included in the company's reports filed with the SEC, including the company's Annual Report on Form 10-K for the year ended December 31, 2009.
The company's expectations regarding the timing and degree of market share growth are only its expectations regarding these matters. Actual timing and degree of market share growth could differ based on a number of factors including (among others) the company's ability to persuade existing customers to increase shipments with the company and to attract new customers, and the factors that affect revenue results (including the risk factors that are from time to time included in the company's reports filed with the SEC, including the Company's annual report on Form 10-K for the year ended December 31, 2009).
The company's expectations regarding the impact of, and the service and operational improvements and collateral and cost reductions due to, the integration of Yellow Transportation and Roadway, improved safety performance, right-sizing the network, consolidation of support functions, the company's credit ratings and the timing of achieving the improvements and cost reductions could differ materially from actual improvements and cost reductions based on a number of factors, including (among others) the factors identified in the prior paragraphs above, the ability to identify and implement cost reductions in the time frame needed to achieve these expectations, the success of the company's operating plans and programs, the company's ability to successfully reduce collateral requirements for its insurance programs, which in turn is dependent upon the company's safety performance, ability to reduce the cost of claims through claims management, the company's credit ratings and the requirements of state workers' compensation agencies and insurers for collateral for self insured portions of workers' compensation programs, the need to spend additional capital to implement cost reduction opportunities, including (without limitation) to terminate, amend or renegotiate prior contractual commitments, the accuracy of the company's estimates of its spending requirements, changes in the company's strategic direction, the need to replace any unanticipated losses in capital assets, approval of the affected unionized employees of changes needed to complete the integration under the company's union agreements, the readiness of employees to utilize new combined processes, the effectiveness of deploying existing technology necessary to facilitate the combination of processes, the ability of the company to receive expected price for its services from the combined network and customer acceptance of those services.
The company's expectations regarding its ability to raise new capital in the equity markets are only its expectations regarding this matter. Whether the company is able to raise new capital is dependent upon a number of factors including (among others) the trading price and volume of the company's common stock and the company reaching agreement with interested investors and closing such transactions on negotiated terms and conditions, including (without limitation) any closing conditions that investors may require.
The company's expectations regarding future asset dispositions and sale and financing leasebacks of real estate are only its expectations regarding these matters. Actual dispositions and sale and financing leasebacks will be determined by the availability of capital and willing buyers and counterparties in the market and the outcome of discussions to enter into and close any such transactions on negotiated terms and conditions, including (without limitation) usual and ordinary closing conditions such as favorable title reports or opinions and favorable environmental assessments of specific properties.
The company's expectations regarding interest and fees (including any deferred amounts) are only its expectations regarding these matters. Actual interest and fees (including any deferred amounts) could differ based on a number of factors, including (among others) the company's expected borrowings under the company's credit agreement and the ABS facility, which is affected by revenue and profitability results and the factors that affect revenue and profitability results (including the risk factors that are from time to time included in the company's reports filed with the SEC, including the company's annual report on Form 10-K for the year ended December 31, 2009), and the company's ability to continue to defer the payment of interest and fees pursuant to the terms of the company's credit agreement, ABS facility and pension fund contribution deferral agreement, as applicable.
The company's expectations regarding its capital expenditures are only its expectations regarding this matter. Actual expenditures could differ materially based on a number of factors, including (among others) the factors identified in the preceding paragraphs.
The company's expectations regarding liquidity are only its expectations regarding this matter. Actual liquidity levels will depend upon (among other things) the company's operating results, the timing of its receipts and disbursements, the company's access to credit facilities or credit markets, the company's ability to continue to defer interest and fees under the company's credit agreement and ABS facility and interest and principal under the company's contribution deferral agreement, the continuation of the existing union wage reductions and temporary cessation of pension contributions, and the factors identified in the preceding paragraphs.
The company's expectations regarding its effective tax rate are only its expectations regarding this rate. The actual rate could differ materially based on a number of factors, including (among others) variances in pre-tax earnings on both a consolidated and business unit basis, variance in pre-tax earnings by jurisdiction, impacts on our business from the factors described above, variances in estimates on non-deductible expenses, tax authority audit adjustments, change in tax rates and availability of tax credits.
YRC Worldwide Inc., a Fortune 500 company headquartered in Overland Park, Kan., is one of the largest transportation service providers in the world and the holding company for a portfolio of successful brands including YRC, YRC Reimer, YRC Glen Moore, YRC Logistics, New Penn, Holland and Reddaway. YRC Worldwide has the largest, most comprehensive network in North America, with local, regional, national and international capabilities. Through its team of experienced service professionals, YRC Worldwide offers industry-leading expertise in heavyweight shipments and flexible supply chain solutions, ensuring customers can ship industrial, commercial and retail goods with confidence. Please visit yrcw.com for more information.
Investor Paul Media Suzanne
Contact: Liljegren Contact: Dawson
YRC Linden
Worldwide Alschuler
Inc. & Kaplan
913.696.6108 212.329.1420
Paul.Liljegren@yrcw.com sdawson@lakpr.com
CONSOLIDATED BALANCE SHEETS
YRC Worldwide Inc. and Subsidiaries
(Amounts in thousands except per share data)
March 31, December 31,
2010 2009
---- ----
ASSETS (Unaudited)
CURRENT ASSETS:
Cash and cash equivalents $130,263 $97,788
Accounts receivable, net 517,093 515,807
Prepaid expenses and other 178,322 245,225
------- -------
Total current assets 825,678 858,820
------- -------
PROPERTY AND EQUIPMENT:
Cost 3,520,447 3,588,474
Less - accumulated depreciation 1,745,423 1,748,996
--------- ---------
Net property and equipment 1,775,024 1,839,478
--------- ---------
OTHER ASSETS:
Intangibles, net 153,389 163,544
Other assets 165,115 170,232
------- -------
Total assets $2,919,206 $3,032,074
========== ==========
LIABILITIES AND SHAREHOLDERS' EQUITY
(DEFICIT)
CURRENT LIABILITIES:
Accounts payable $214,525 $198,725
Wages, vacations, and employees'
benefits 209,349 216,074
Other current and accrued liabilities 567,417 397,902
Current maturities of long-term debt 211,603 197,127
------- -------
Total current liabilities 1,202,894 1,009,828
--------- ---------
OTHER LIABILITIES:
Long-term debt, less current portion 948,864 935,782
Deferred income taxes, net 145,751 146,576
Pension and post retirement 353,398 351,861
Claims and other liabilities 373,243 420,837
SHAREHOLDERS' EQUITY (DEFICIT):
Preferred stock, $1 par value per share - 4,346
Common stock, $0.01 par value per share 10,566 991
Capital surplus 1,571,413 1,576,349
Accumulated deficit (1,451,418) (1,177,280)
Accumulated other comprehensive loss (142,768) (144,479)
Treasury stock, at cost (3,079 shares) (92,737) (92,737)
------- -------
Total shareholders' equity (deficit) (104,944) 167,190
-------- -------
Total liabilities and shareholders'
equity (deficit) $2,919,206 $3,032,074
========== ==========
STATEMENTS OF CONSOLIDATED OPERATIONS
YRC Worldwide Inc. and Subsidiaries
For the Three Months Ended March 31
(Amounts in thousands except per share data)
(Unaudited)
2010 2009
---- ----
OPERATING REVENUE $1,063,235 $1,502,795
---------- ----------
OPERATING EXPENSES:
Salaries, wages, and employees'
benefits 670,826 1,133,974
Equity based compensation
expense 109,871 33,025
Operating expenses and supplies 253,349 367,292
Purchased transportation 132,456 175,184
Depreciation and amortization 52,261 66,269
Other operating expenses 67,013 104,705
Losses on property disposals,
net 8,998 1,593
Impairment charges 5,281 -
----- ---
Total operating expenses 1,300,055 1,882,042
--------- ---------
OPERATING INCOME (LOSS) (236,820) (379,247)
-------- --------
NONOPERATING (INCOME) EXPENSES:
Interest expense 41,074 32,219
Other 2,178 3,701
----- -----
Nonoperating expenses, net 43,252 35,920
------ ------
INCOME (LOSS) BEFORE INCOME
TAXES (280,072) (415,167)
INCOME TAX PROVISION (BENEFIT) (5,934) (141,385)
NET INCOME (LOSS) $(274,138) $(273,782)
========= =========
AVERAGE SHARES OUTSTANDING-
BASIC 521,216 59,373
AVERAGE SHARES OUTSTANDING-
DILUTED 521,216 59,373
BASIC EARNINGS (LOSS) PER SHARE $(0.53) $(4.61)
DILUTED EARNINGS (LOSS) PER
SHARE $(0.53) $(4.61)
STATEMENTS OF CONSOLIDATED CASH FLOWS
YRC Worldwide Inc. and Subsidiaries
For the Three Months Ended March 31
(Amounts in thousands)
(Unaudited)
2010 2009
---- ----
OPERATING ACTIVITIES:
Net income (loss) $(274,138) $(273,782)
Noncash items included in net income
(loss):
Depreciation and amortization 52,261 66,269
Equity based compensation expense 109,871 33,025
Impairment charges 5,281 -
Pension settlement charge - 5,003
Losses on property disposals, net 8,998 1,593
Deferred income tax benefit, net (5,841) (141,741)
Amortization of deferred debt costs 10,516 4,488
Other noncash items 1,964 2,836
Changes in assets and liabilities, net:
Accounts receivable (1,317) 118,740
Accounts payable 15,811 (49,863)
Other operating assets 71,213 52,307
Other operating liabilities 23,671 87,119
------ ------
Net cash provided by (used in) operating
activities 18,290 (94,006)
------ -------
INVESTING ACTIVITIES:
Acquisition of property and equipment (3,731) (15,424)
Proceeds from disposal of property and
equipment 7,637 18,707
Restricted cash - (17,617)
Other - (198)
--- ----
Net cash provided by (used in) investing
activities 3,906 (14,532)
----- -------
FINANCING ACTIVITIES:
ABS borrowings (payments), net (28,618) 41,211
Issuance of long-term debt 119,748 157,617
Repayment of long-term debt (59,363) (129,149)
Debt issuance costs (7,030) (37,971)
Equity issuance costs (14,458) -
------- ---
Net cash provided by financing activities 10,279 31,708
------ ------
NET INCREASE (DECREASE) IN CASH AND CASH
EQUIVALENTS 32,475 (76,830)
CASH AND CASH EQUIVALENTS, BEGINNING OF
PERIOD 97,788 325,349
CASH AND CASH EQUIVALENTS, END OF PERIOD $130,263 $248,519
======== ========
SUPPLEMENTAL CASH FLOW INFORMATION
Income tax refund, net $81,272 $37,266
Pension contribution deferral transfer to
debt $3,488 $-
SUPPLEMENTAL FINANCIAL INFORMATION
YRC Worldwide Inc. and Subsidiaries
For the Three Months Ended March 31
(Amounts in thousands)
(Unaudited)
2010 2009 %
---- ---- ---
Operating revenue:
YRC National Transportation $663,063 $1,022,610 (35.2)
YRC Regional Transportation 309,154 355,168 (13.0)
YRC Logistics 76,092 112,120 (32.1)
YRC Truckload 26,885 25,976 3.5
Eliminations (11,959) (13,079)
------- -------
Consolidated 1,063,235 1,502,795 (29.2)
Operating income (loss):
YRC National Transportation (185,060) (299,771)
YRC Regional Transportation (39,631) (74,125)
YRC Logistics (7,448) (3,444)
YRC Truckload (3,061) (2,246)
Corporate and other (1,620) 339
------ ---
Consolidated $(236,820) $(379,247)
Operating ratio:
YRC National Transportation 127.9% 129.3%
YRC Regional Transportation 112.8% 120.9%
YRC Logistics 109.8% 103.1%
YRC Truckload 111.4% 108.6%
Consolidated 122.3% 125.2%
(Gains) losses on property
disposals, net:
YRC National Transportation $4,949 $1,312
YRC Regional Transportation 3,669 211
YRC Logistics 200 (6)
YRC Truckload 42 76
Corporate and other 138 -
--- ---
Consolidated $8,998 $1,593
SUPPLEMENTAL INFORMATION
March 31, December 31,
2010 2009
---- ----
Current debt:
Asset backed securitization
borrowings $117,667 $146,285
Lease financing obligations 2,265 2,671
Pension contribution deferral
obligation 70,000 20,500
Contingent convertible senior
notes 21,671 21,671
Industrial development bonds - 6,000
--- -----
Total current debt 211,603 197,127
Long-term debt, less current
portion:
Lease financing obligations 317,353 316,221
Pension contribution deferral
obligation 84,895 132,541
USF senior notes - 45,289
Term loan 112,507 112,612
Revolving credit facility 387,650 329,119
6% convertible senior notes 46,459 -
------ ---
Total long-term debt, less
current portion 948,864 935,782
Total debt $1,160,467 $1,132,909
========== ==========
Letters of credit
Credit facility 451,494 461,032
Asset backed securitization 72,180 77,180
Total letters of credit $523,674 $538,212
======== ========
SUPPLEMENTAL FINANCIAL INFORMATION
YRC Worldwide Inc. and Subsidiaries
(Amounts in thousands)
(Unaudited)
January 2010 February 2010 March 2010
------------ ------------- ----------
Reconciliation of operating
loss to adjusted EBITDA:
Operating loss $(48,839) $(41,878) $(146,103)
Depreciation and
amortization 17,271 16,987 18,003
Equity based compensation
expense 627 597 108,647
Letter of credit expense 2,850 2,714 2,790
Losses on property
disposals, net 35 (249) 9,212
Impairment charges - - 5,281
Other, net 484 901 (2,499)
Adjusted EBITDA $(27,572) $(20,928) $(4,669)
======== ======== =======
For the Three Months Ended March 31
2010 2009
---- ----
Reconciliation of operating loss to
adjusted EBITDA:
Operating loss $(236,820) $(379,247)
Depreciation and amortization 52,261 66,269
Equity based compensation expense 109,871 33,025
Letter of credit expense 8,354 5,473
Losses on property disposals, net 8,998 1,593
Impairment charges 5,281 -
Other, net (1,114) (1,888)
Adjusted EBITDA $(53,169) $(274,775)
======== =========
Adjusted EBITDA by segment:
YRC National Transportation $(60,313) $(238,506)
YRC Regional Transportation 8,356 (49,908)
YRC Logistics (5,943) (854)
YRC Truckload (211) 205
Corporate and other 4,942 14,288
----- ------
Adjusted EBITDA $(53,169) $(274,775)
======== =========
Adjusted EBITDA $(53,169) $(274,775)
======== =========
Friday, May 14, 2010
China Star Entertainment (HK:0326)
I purchased China Star Entertainment (CSE) at HKD0.151.
Background of the Company
China Star Entertainment Group was established in 1992 by Charles Heung, who is the studio's CEO chairman, with his wife, Tiffany Chen, serving as Vice Chairman and administrative producer. It is a huge distributor and film producer of films made mostly in Cantonese dialect.
China Star Entertainment and its subsidiaries are principally engaged in the production and distribution of films and television drama series that are in Chinese dialect, many of which have won various awards. The company has also engaged in the provision of artists management services and post-production services.
In recent years, it has restarted its hotel operations, and acquired a company that has claim on the profits of those generated in one of the VIP rooms in the Grand Lisboa, Macau.
(as taken from wikipedia)
I am sure that many of us have watched the films that they have produced, such as Love on a Diet, La Brassiere and My Left Eyes Sees Ghost.
In 2006, CSE acquired Kingsway Hotel Limited in Macau, and refurbished it before reopening it in August 2009. The hotel has 200 rooms, a gaming room, with table games and slot machines.
In 2008, CSE acquired Best Mind International Inc, which has a 100% in 0.4% of the turnover generated by Ocho Sociedade Unipessoal Limitada. Ocho is a junket representative in one of the VIP gaming rooms at the Grand Lisboa Casino in Macau. A profit guarantee was provided of HK$72 million, HK$192 million and HK$120 million for the period from 17 August 2007 to 31 December 2007, the year ended 31 December 2008 and the period from 1 January 2009 to 16 August 2009 respectively.
Income Statement
 As we can see, the hotel operations were only started in 2009, and the gaming promotion operations started in 2008.
What is interesting to note is that as of 2008, the gaming promotion operations generated HKD203,327,000, which as stated on the annual report was 34% higher than the HKD151,385,000, which was different from the profit guarantee as stated in their company profile of HKD 192million. Likewise, the profit guarantee was not restated in 2008 for the year 2007, of HKD 72million. I spent very long trying to figure out this red flag, and came to two possible conclusions. (1) the profit guarantee was restated as of date of acquisition, or (2) the company restated its profit guarantee as it sees fit.
This doubt did not last for long, as seeing the amount the gaming promotion operations is bringing in, it shows that the demand for gaming is there, and this would also help out its hotel business, which has its own gaming arm as well. Furthermore, it shows that high end gamblers are still flocking to Macau despite the financial crisis that happened. Overall, the revenue obtained from the gaming arm was about 29.7% more than the guaranteed amount.
Generally, the average occupancy rate of hotel rooms in Macau increased from 75.47% in March 2008, to 82.22% in December 2009, with a dip in between. As of March 2010, the average occupancy rate was hovering about 77%. Gross gaming revenue of Macau, however, has recovered from a previous high of MOP10,220million in March 2008 before the financial meltdown to MOP 11,450.6 in Dec 2009. In March 2010, gaming revenue was recorded at MOP13,665.9million.
Another point to note is how badly the film distribution arm is doing. The segment profit was HKD8,336,000 in 2007, a loss of HKD19,128,000 in 2008 and another loss of HKD11,738,000 in 2009. The company has attributed it to rampant piracy that is eating away at their margins, and in this case, posting net losses. I look for China Star Entertainment to divest its holdings or shut down its film distribution arm sooner rather than later.
The amount of turnover from the VIP room at Grand Lisboa has allowed it to increase its gross margins to 90%.
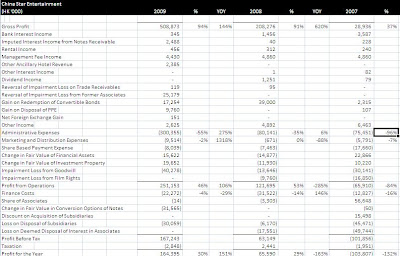 One thing that stands out is the admin expenses (the row where the cursor is). Admin expenses has risen by 275% year on year, while marketing and distribution expenses increased by 1318%. This was attributable to the opening of the LKF hotel in Macau, as SG&A expenses were incurred throughout the year, but revenue collection only started in August.
Another point that makes me feel uncomfortable is the high finance costs, being 4% of sales. However, this is offset by the low cost of sales attributable to the Gaming Promotion Arm. I look for them to lower the absolute amount. There was a 29% decrease from 2008. Although the absolute bank borrowings increased (that will be covered in the Balance Sheet analysis), CSE has managed to reduce the interest expense due to lower borrowing rates. However, there is a bank overdraft liability that exists on the balance sheet that has not been paid off.
Over the past 2 years, CSE has retained most of its profit, only paying out 5.46% of its total profits made over the period.
The P/E ratio at its current price based on 2009 earnings is 0.66, while based on the current number of shares issued, the P/E average of 2 years earnings (since the acquisition of Kingsway Hotel and Best Mind International) is 1.16.
Balance Sheet
Several key figures found in the balance sheet
 The figures are for 2009 (on the left) vs 2008. What is noteworthy is that the leverage of the company has decreased, and the current ratio of the company has increased. Although the net current asset per share is negative, it has been reduced from HKD-0.6 to HKD-0.02. The NTA of the company is at 1.43, a 33 cents increase from 2008. Given it's current price, it is trading at a discount of 89.5% to its tangible book value.
Why Purchase?
There are some lingering doubts that I had before I purchased the shares of the company
(1) Why wasn't bank overdraft repaid? Are they in a need of cash for working capital purposes?
An analysis of the Cash Flow statement puts Free Cash Flow marginally positive for the year ended 2009. For 2008, FCF was negative. Working Capital was HKD46million for year ended 2009, compared to year ended 2008, which was HKD-34million.
With the reassurance that the cash flow was improving, the bank overdraft not being repaid does not warrant a huge emphasis. Instead, I would look the the company to decrease the overdraft over the next year.
(2) Lack of a Dividend
The company, even before it's diversification, has not paid out dividends to its shareholders except in 2008, of HKD0.02. This is due to the need to retain cash for its diversification policies in order to deal with the decreasing profits/increasing losses from the film distribution arm. I do not foresee a dividend in the coming year, however within the next 2 financial years, should results continue improving, the lack of a dividend would be a red flag.
(3) Possible Divestment of Film Distribution Arm
I would look for the company to divest its money bleeding film distribution arm over the next few years. Should the company continue this arm for reasons other than profiteering, I would have to reconsider the investment in CSE.
Conclusion
I definitely feel that CSE is a company reborn since its diversification. Its results have been impressive, and should it manage to reduce the bank overdraft over the next year, it would show good management decisions being made.
It would also be good to look at the results for the next few quarters, as the profit guarantee has expired. However, with the amount of revenue being brought in by the gaming promotion arm exceeding the profit guarantee, it does not seem like a big worry.
Background of the Company
China Star Entertainment Group was established in 1992 by Charles Heung, who is the studio's CEO chairman, with his wife, Tiffany Chen, serving as Vice Chairman and administrative producer. It is a huge distributor and film producer of films made mostly in Cantonese dialect.
China Star Entertainment and its subsidiaries are principally engaged in the production and distribution of films and television drama series that are in Chinese dialect, many of which have won various awards. The company has also engaged in the provision of artists management services and post-production services.
In recent years, it has restarted its hotel operations, and acquired a company that has claim on the profits of those generated in one of the VIP rooms in the Grand Lisboa, Macau.
(as taken from wikipedia)
I am sure that many of us have watched the films that they have produced, such as Love on a Diet, La Brassiere and My Left Eyes Sees Ghost.
In 2006, CSE acquired Kingsway Hotel Limited in Macau, and refurbished it before reopening it in August 2009. The hotel has 200 rooms, a gaming room, with table games and slot machines.
In 2008, CSE acquired Best Mind International Inc, which has a 100% in 0.4% of the turnover generated by Ocho Sociedade Unipessoal Limitada. Ocho is a junket representative in one of the VIP gaming rooms at the Grand Lisboa Casino in Macau. A profit guarantee was provided of HK$72 million, HK$192 million and HK$120 million for the period from 17 August 2007 to 31 December 2007, the year ended 31 December 2008 and the period from 1 January 2009 to 16 August 2009 respectively.
Income Statement
 As we can see, the hotel operations were only started in 2009, and the gaming promotion operations started in 2008.
What is interesting to note is that as of 2008, the gaming promotion operations generated HKD203,327,000, which as stated on the annual report was 34% higher than the HKD151,385,000, which was different from the profit guarantee as stated in their company profile of HKD 192million. Likewise, the profit guarantee was not restated in 2008 for the year 2007, of HKD 72million. I spent very long trying to figure out this red flag, and came to two possible conclusions. (1) the profit guarantee was restated as of date of acquisition, or (2) the company restated its profit guarantee as it sees fit.
This doubt did not last for long, as seeing the amount the gaming promotion operations is bringing in, it shows that the demand for gaming is there, and this would also help out its hotel business, which has its own gaming arm as well. Furthermore, it shows that high end gamblers are still flocking to Macau despite the financial crisis that happened. Overall, the revenue obtained from the gaming arm was about 29.7% more than the guaranteed amount.
Generally, the average occupancy rate of hotel rooms in Macau increased from 75.47% in March 2008, to 82.22% in December 2009, with a dip in between. As of March 2010, the average occupancy rate was hovering about 77%. Gross gaming revenue of Macau, however, has recovered from a previous high of MOP10,220million in March 2008 before the financial meltdown to MOP 11,450.6 in Dec 2009. In March 2010, gaming revenue was recorded at MOP13,665.9million.
Another point to note is how badly the film distribution arm is doing. The segment profit was HKD8,336,000 in 2007, a loss of HKD19,128,000 in 2008 and another loss of HKD11,738,000 in 2009. The company has attributed it to rampant piracy that is eating away at their margins, and in this case, posting net losses. I look for China Star Entertainment to divest its holdings or shut down its film distribution arm sooner rather than later.
The amount of turnover from the VIP room at Grand Lisboa has allowed it to increase its gross margins to 90%.
 One thing that stands out is the admin expenses (the row where the cursor is). Admin expenses has risen by 275% year on year, while marketing and distribution expenses increased by 1318%. This was attributable to the opening of the LKF hotel in Macau, as SG&A expenses were incurred throughout the year, but revenue collection only started in August.
Another point that makes me feel uncomfortable is the high finance costs, being 4% of sales. However, this is offset by the low cost of sales attributable to the Gaming Promotion Arm. I look for them to lower the absolute amount. There was a 29% decrease from 2008. Although the absolute bank borrowings increased (that will be covered in the Balance Sheet analysis), CSE has managed to reduce the interest expense due to lower borrowing rates. However, there is a bank overdraft liability that exists on the balance sheet that has not been paid off.
Over the past 2 years, CSE has retained most of its profit, only paying out 5.46% of its total profits made over the period.
The P/E ratio at its current price based on 2009 earnings is 0.66, while based on the current number of shares issued, the P/E average of 2 years earnings (since the acquisition of Kingsway Hotel and Best Mind International) is 1.16.
Balance Sheet
Several key figures found in the balance sheet
- Assets as of YE2009 totaled HKD3190million
- Current Assets as of YE2009 totaled 853million
- Intangible Assets + GW as of YE2009 totaled HKD998million
- Liabilities as of YE2009 totaled HKD870million
- Bank Borrowings totaled HKD410million, of which 232million is classified as current liabilities. There has been a marginal reduction of bank borrowings from 2008.
- Bank Overdraft was not repaid in 2009, instead it has increased from HKD174million to HKD 178million.
 The figures are for 2009 (on the left) vs 2008. What is noteworthy is that the leverage of the company has decreased, and the current ratio of the company has increased. Although the net current asset per share is negative, it has been reduced from HKD-0.6 to HKD-0.02. The NTA of the company is at 1.43, a 33 cents increase from 2008. Given it's current price, it is trading at a discount of 89.5% to its tangible book value.
Why Purchase?
There are some lingering doubts that I had before I purchased the shares of the company
(1) Why wasn't bank overdraft repaid? Are they in a need of cash for working capital purposes?
An analysis of the Cash Flow statement puts Free Cash Flow marginally positive for the year ended 2009. For 2008, FCF was negative. Working Capital was HKD46million for year ended 2009, compared to year ended 2008, which was HKD-34million.
With the reassurance that the cash flow was improving, the bank overdraft not being repaid does not warrant a huge emphasis. Instead, I would look the the company to decrease the overdraft over the next year.
(2) Lack of a Dividend
The company, even before it's diversification, has not paid out dividends to its shareholders except in 2008, of HKD0.02. This is due to the need to retain cash for its diversification policies in order to deal with the decreasing profits/increasing losses from the film distribution arm. I do not foresee a dividend in the coming year, however within the next 2 financial years, should results continue improving, the lack of a dividend would be a red flag.
(3) Possible Divestment of Film Distribution Arm
I would look for the company to divest its money bleeding film distribution arm over the next few years. Should the company continue this arm for reasons other than profiteering, I would have to reconsider the investment in CSE.
Conclusion
I definitely feel that CSE is a company reborn since its diversification. Its results have been impressive, and should it manage to reduce the bank overdraft over the next year, it would show good management decisions being made.
It would also be good to look at the results for the next few quarters, as the profit guarantee has expired. However, with the amount of revenue being brought in by the gaming promotion arm exceeding the profit guarantee, it does not seem like a big worry.
Tuesday, May 4, 2010
Portfolio Review Apr 2010
For the month of April, the news came fast and furious.
Internationally, Goldman Sachs, Greece along with the rest of the PIGS, and the volcanic ash cloud from Iceland which shut down European airspace were the main focus of this month.
News that Goldman Sachs was facing a criminal probe into its activities with regard to mortgage transactions sent the stock spiralling, losing approximately US$30 (17%) off each share since the news broke. The essence of the story was that Goldman Sachs is accused of failing to notify the investors that Paulson and Co, a hedge fund, helped select mortgages for one of its products, and then bet against it. Paulson and Co has been absolved of any blame in this case. The story is still unravelling. More can be read here.
Greece once again took the focus of investors worldwide, with protests going on in Greece as the unions are against the austerity measures that the government has to introduce in order to receive a bailout from the EU and IMF. The failure of Greece to obtain the bailout has resulted in its debt being downgraded to junk bond status by S&P. In the same day, Spain's debt was downgraded, although not to junk bond status. It was also reported that Spain's unemployment had hit 20%, putting it in the same league as Latvia.
Many jokes were spun about Iceland's volcanic ash eruption. The first country to suffer from the financial crisis in Europe, it yet again became another starter of events. This time, the volcano (don't ask me what's its name, I'm pretty sure even Icelanders are unable to spell it right) spewed ash, forcing a shutdown of European airspace, causing a disaster to airlines worldwide, leaving many stranded. The shutdown of the airspace racked up losses for airlines. The full extent however, is still unable to be determined, as airlines and governments are negotiating on any compensation available.
Locally, news that grabbed the headlines was the opening of the circle line from Tai Seng to Dhoby Ghaut. Although it has not affected me, the feedback thus far was that it has managed to cut short journey times. As the government tries to move away from long distance bus, it would have an effect on SMRT as well as SBS Transit as publicly traded companies.
Housing prices has continued rising (making me look like a fool in the process), and there seems to be no end, with many property owners near the Circle Line trying to cash in on the current property market boom in tandem with the opening of the Circle Line itself.
My portfolio took a huge hit, dropping 2% from the month before. In addition, I sold Transpac Industrial Holdings in order to remain partially in cash, and to take advantage before the dividends were paid out.
 First Resources
First Resources had its AGM on the 28th of April. It was my first ever AGM and it was interesting hearing the management comments. Of course there were questions that were posed that seemed out of management control.
The CEO and I had a chat, and he put it across to us that the company's growth, even if they did not have any new plantings or acquisitions, would still be robust. Greenpeace allegations that Golden Agri faced were also a topic. He confidently said that Greenpeace was definitely an issue with plantations, and the main way to resolve it was to talk to them, which in the case of First Resources, they had an open door policy with Greenpeace.
Hearing that was good that the management avoided saying that they would never face the situation, but instead said about what they would do if it happened.
China Telecom
China Telecom reported 1Q results, with net profit down 9% on increased 3G spending. Sales however, rose 3.6%. The results meant analysts expectations. The stock however, has took a tumble over the past two weeks due to broad market factors, as well as it China telecom companies rotational play. However, the story behind China Telecom is still intact, as it added 9.36million subscribers in 1Q, compared to 4.93million subscribers the year before.
Novo Group
Little news came out of Novo Group, besides the selling of the remaining 10million treasury shares. There are no treasury shares remaining in Novo after the sale.
Blue Gem Enterprise
Blue Gem Enterprise has expanded into the Refrigerated Direct Store Delivery Division, and thus is able to diversify into the distribution of dairy products on top of beverages. More news can be found here.
Soilbuild
Soilbuild announce that it has won an industrial site bid at Yishun Ave 6 for $29.3million. It is slated to be for SMEs and supporting businesses of MNCs in Singapore. At the EGM, it also approved of the 2 for 1 stock split on the 25th of May.
YRC Worldwide
YRC results are slated to be at 930ET today. Just before the end of the month, YRC Worldwide's stocks dropped like a rock, without any reasons. More can be found here. However, I did not add to my positions, preferring to remain in cash to explore other opportunities, as well as waiting for the results announcement before deciding.
Tuesday, April 27, 2010
Trip up to KL
I took a trip up to KL over the last weekend to meet up with some of my friends for a weekend getaway. On the way up via the North South Highway via the Second Link, it was good seeing vast open spaces compared to the urban jungle that we see in Singapore. More importantly, it was good looking out of the window to vast amount of palm plantations which got me looking, thinking and ultimately digging further into information about the palm oil industry.
(1) Mature and Immature
Sounds really easy at first, where mature palms are those that are able to produce palm fruits and immature ones are those that have not started producing fruits. Travelling along the highway, what I saw was the really new plantations, where you see the palm leaves just sprouting; medium height plantations, where you could see a short trunk; and the older palms, where it looks exactly like a tree.
So when do palm trees produce their highest yield? That was an immediate concern that came to my mind. Firms may classify their palms as mature, however it may be near the tail end or past the peak production age. What I found out was palm oil yields were highest were from the 6th year to the 12th year. After that, the yields will start decreasing.
(2) What happens after death?
I saw a few plantations where there were withering trees, or just clearings. A few questions came to my mind.
First, what is the life of the palm tree, and given that yields decline after 12 years of age? In the article "The Optimal Age of Palm Oil Replanting", they have stated that the optimal age of replanting based on marginal revenues would be of 30 years of age, when after that the palm trees get too tall, and yields will be too low to support the labour costs. However, I have my doubts on the viability of replanting trees when they reach 30 considering that yields may be too low to sustain the total sum of all costs (including SG&A costs).
Second, how long will it take before the land is viable to replace palm trees? Would they do better to replant on uncultivated land or replant on land that has been planted on before? Thus far, I am unable to determine the answer to the question, and I am currently finding more information on this topic. However, one thing I noted was if it ever came to this situation, chances are the company does not have a large enough land bank, which may be detrimental to future expansion plans.
(3) Wide Open Spaces
One thing I noticed is that wherever there was wide open spaces, there were palm trees. From an industry point of view, it would mean that there will be ample supply. However, this may cause prices to be depressed in the situation where supply exceeds demand. Interestingly, with the current weather patterns said to cause yields to be lower, the issue of supply outstripping demand has not been a big issue to deal with as yet. In the future, there is a need to consider this supply demand balance.
Later today, I will be attending FR's AGM, and I hope it would be a good experience (especially with the food). There will be a summary of the AGM, and a review of property prices coming up in the next week or two.
Subscribe to:
Posts (Atom)